


Table of Contents
Trading Candle Reading in Stocks, have you ever checked a stock chart and thought about what those colorful bars mean? Then you are one of the most. Candle reading, also known as an interpretation of a candlestick charts, is a crucial must-learn tool for stock traders. This is a guide that shall give you a run through the basics so you can know how to understand trading candles at the same time making informed trade decisions.
Trading Candle Reading in Stocks Definition
Trading candles, or candlestick charts, are a method of graphically illustrating the price movements of a stock over a particular period. Every “candle” indicates high and low prices with opening and closing within that particular time zone.
Why Use Candlestick Charts?
- Visual Clarity: We can see a clear image of price action through this.
- Pattern Recognition: Traders can identify patterns that indicate potential market movements.
- Decision-Making: Aids traders in making the right decisions by using past price data.
Body of a Candlestick
Body
The area between opening and closing price on candles within specific time zone is called body of candle. A green or white body indicates that the closing price of that candle in that specific time zone was higher than the opening price, signifying a bullish trend. A red (or black) body means the closing price was lower than the opening price, indicating a bearish trend in Trading Candle Reading in Stock.
The Wicks (or Shadows)
The wicks or shadows of the upper and lower lines of candle body are referred to. The highest price of that period is reflected in the higher wick and the lowest price by the lower wick.
Color
- Green/White Candles: The stock has closed above where it has opened.
- Red/Black Candles: This reflects the fact that the stock closed below its opening price.
Popular Candlestick Patterns
Doji
A Doji candlestick is marked by an extremely small body, which may indicate indecision in the market. It might be a reversal signal.
Hammer
Hammer is marked by a very small body and a long lower wick. It tends to be a bullish reversal after downtrend.
Shooting Star
A candle with very small body and super long upper wick is called shooting star. Generally, it’s a bearish reversal after an uptrend.
Bullish Engulfing
In a Bullish Engulfing pattern, a small red candle is followed by a large green candle that engulfs the previous candle, which indicates the possibility of an upward trend.
Bearish Engulfing
On the other hand, a Bearish Engulfing pattern occurs when a small green candle is followed by a large red candle, which may point to a downward trend.
Using Candlestick Patterns in Trading
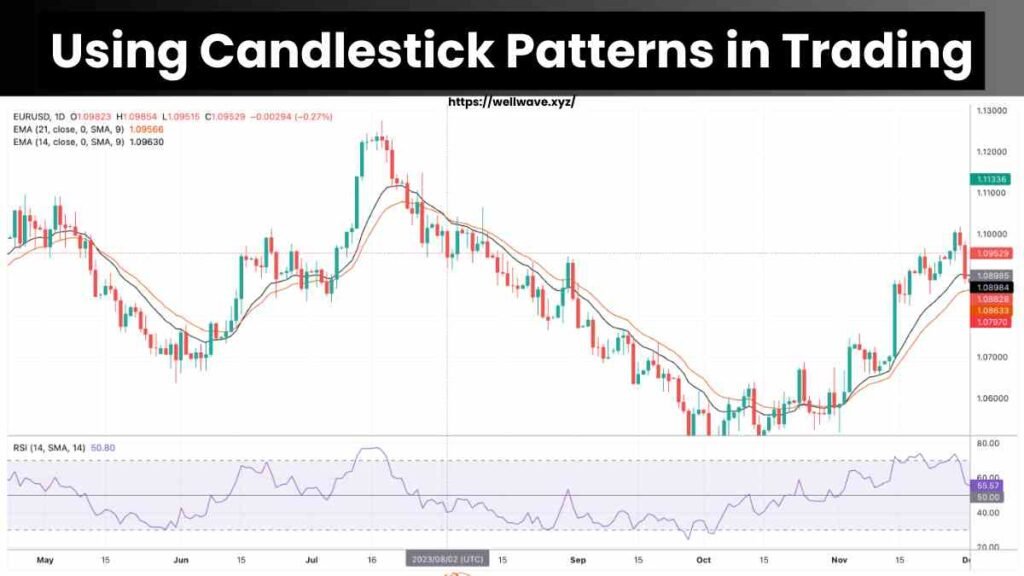
Identify Trends
- Look out for candlestick patterns that may show a change in the ongoing trend.
Use for entry/exit
- This is handy when the trader is intent on entering or leaving the trade.
Together with Other Indicators
- The power of candlestick patterns is determined by the use of other technical indicators.
- It also applies to moving averages, RSI and/or MACD.
Set Stop-loss Orders
- You can use candlestick patterns to set stop-loss orders where you sell a stock once it has reached a certain price.
Follow Us: Well Wave
Reading Multiple Time Frames
Short-Term vs. Long-Term
Different time frames can tell different stories. A pattern on a daily chart (may be of different time zones) suggest as different from market trend of weekly chart.
Common Mistakes to Avoid
Overlooking Context
The reliability of a candlestick pattern might be lacking when not viewed within a context of an existing trend. Be sure to think of the broader market.
Overtrading
Avoid making unnecessary trades with any patterns that show up. Instead, wait for confirmations through other indicators before opening any positions.
Not Practicing
Reading candlestick patterns needs practice. I would recommend that you should begin with a demo trading account provided by many exchanges and brokers which is considered as the best to practice and test your trading skills. It also saves your real money from wastage.
Conclusion
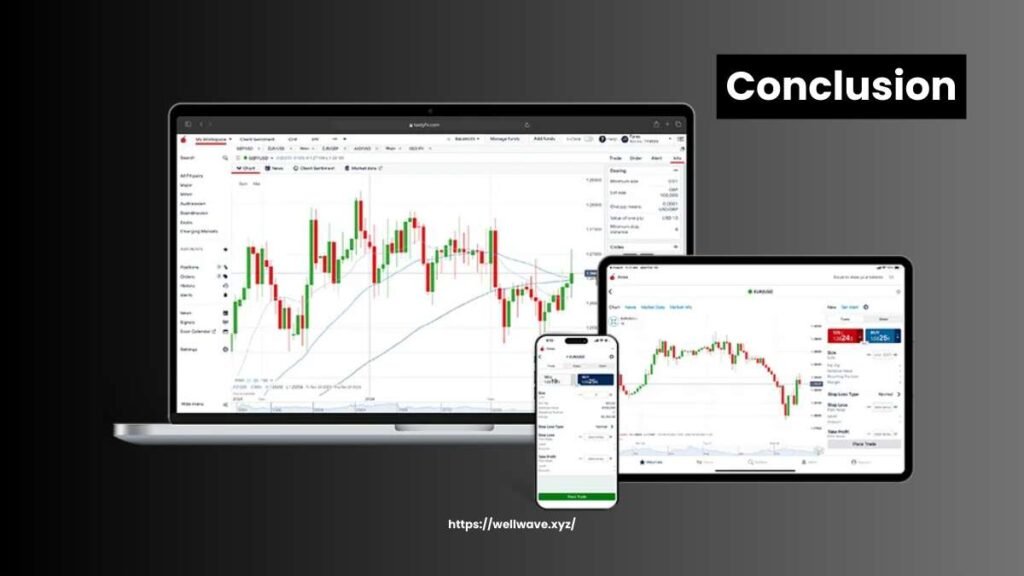
Mastering candle reading in trading is an art that every successful stock trader acquires. Once a person understands basic candlestick charting and identifying common patterns, such a person makes better trading decisions. Do not forget to incorporate candlestick patterns with other technical indicators and try to look into the broader context of the market.
Frequently Asked Question
What is the purpose of trading candle reading?
Trading candle reading helps the trader to see the price movement and identify potential market trends.
Which colors are used for bullish and bearish trends in candlestick charts?
Green or white candles indicate bullish trends, while red or black candles indicate bearish trends.
Can I depend solely on candlestick patterns for trading decisions?
No, one should use candlestick patterns with other technical indicators for better accuracy.
What is the most common mistake when reading candlestick charts?
A common mistake is overtrading based on every pattern without considering context or confirmation.
Are candlestick patterns useful for all time frames?
Yes, but patterns can vary in significance across time frames, so analyzing multiple periods is important.
Read More: Digital Literacy and Education